
Why lead count is the weakest number in your marketing report
Most accounting firms judge their marketing on how many leads arrived last month. It is the same single-number thinking a firm would correct in a client who judges his year by his bank balance. This is for firm owners who want their reporting to tell them something useful.
Ask most firm owners how their marketing is performing and you get one figure back: the lead count. Twenty-two last month, eighteen the month before, so something must be working or something must be wrong. That single number then decides whether spend goes up, comes down or stays where it is.
We think this is the weakest metric in the whole report, and firms already know why. Every accountant has met the client who judges his trading year by the balance in his current account. The number is real, it is easy to read, and it tells him almost nothing about the state of his business.
The argument below is simple. Lead count is an input. The things that matter all happen after the lead, and they are measurable.
The client you would already correct

Picture the client who calls in April, cheerful, because there is money in the account. He has not looked at the corporation tax provision, the VAT quarter or the invoices he owes his subcontractors. He has looked at one line on his banking app and drawn a conclusion about a whole year of trading.
No firm accepts that. You would pull the management accounts, walk him through what the balance actually contains and explain politely that a single figure is not a position. The judgement is not unkind, it is professional. One number, read in isolation, is not evidence.
Which makes it worth asking what your own marketing report looks like.
One figure is deciding your spend

In most firms we look at, the marketing decision each month rests on a single figure. Leads were up, so the budget holds or grows. Leads were down, so the agency gets a call or the campaign gets paused. Nothing else is on the page.
The problem is not that the figure is wrong. It is usually accurate. The problem is that it stops exactly where the interesting part begins. Whether those enquiries answered the phone, booked in, turned up, sent records and signed an engagement letter is all invisible. So the spend is being steered by the one section of the process nobody argues about, while every stage that actually produces fee income goes unreported.
A lead count is a bank balance. It is a real figure that describes a moment rather than a business, and it stays high while everything underneath it quietly gets worse.
The number is lead count
Let us name it plainly. The number is lead count, sometimes dressed up as enquiries, form fills or new contacts. It arrives in a monthly email or a dashboard tile, it is compared to last month, and that comparison becomes the verdict on the entire acquisition system.
Lead count earned its place because it is the easiest thing to capture. A form submits, a row appears, a counter increases. Everything after that point involves people, calendars, follow-up and judgement, which means it needs a process to record it. So the industry settled on the metric that requires no process, and then started treating it as proof.
Every firm reports it this way
This is not one bad agency or one careless practice manager. It is the standard. Across the firms we speak to, the marketing report almost always stops at the form fill, and both sides are comfortable with that because both sides can see the figure clearly.
Two boxes, in effect. Money went in, names came out. It looks like a system of measurement because it has a number at either end, but it describes the shallowest possible view of what happened. Nobody in the chain is being dishonest. The reporting simply mirrors what is easy to collect rather than what a firm owner needs in order to make a decision about spend.
Leads and clients move separately
Here is the practical failure. Lead count and new client count are two different series, and they can move in opposite directions for months without anyone noticing.
A campaign broadens its targeting and enquiry volume rises. The enquiries are less qualified, so booking rates fall. Fewer people attend the calls they book. Conversion drops. The report shows a healthy increase while the fee book shows nothing new. Because the only tracked figure went the right way, the response is usually to spend more on the thing that is quietly getting worse. That is the mechanism by which a firm can double its enquiries and add fewer clients than it did the previous quarter.
Back to the Friday bank check

Return to the client for a moment, because the parallel does the explaining better than any marketing language.
He checks the balance on a Friday afternoon. Cash has come in that week, the figure is higher than last Friday, and he feels fine about it. He is not lazy or reckless. He is using the one piece of information that is available to him without effort, and he is drawing the most natural conclusion from it. The balance went up, so the business must be going well. Everyone reading this has had that conversation with a client, and everyone reading this knows how it ends.
Most of the balance was owed

It ends when you break the figure down. A large share of that cash belonged to HMRC, sitting there as VAT collected on someone else's behalf and tax accruing on profits already earned. More of it was owed to suppliers. The balance was real and the position was poor.
Lead count behaves the same way. A batch of thirty enquiries might contain a handful of sole traders looking for a price, several people who will never answer the phone again, two who wanted something the firm does not offer, and three genuine opportunities. The headline figure counts all thirty identically. The composition is where the value sits, and the composition is never in the report.
Why nobody looked further

The reason this runs for so long is uncomfortable. Nobody looks past a number that reads well.
If enquiries are up, the monthly review takes four minutes and everyone moves on to billing and deadlines. Interrogation only happens when the headline turns bad, which means the firm investigates its marketing precisely when the figures are worst and never when they are flattering. The same pattern shows up in client work, where a healthy top line stops anyone reading the pages behind it. One good line at the front buys silence for everything behind it, and that silence is expensive.
What the blind spot costs
The cost is straightforward and it compounds. Months of budget go into channels, keywords and audiences that generate names and never generate engagement letters. Because the only measure applied is volume, the worst performing sources often look like the best ones, since cheap enquiries are easy to produce in quantity.
There is a second cost that rarely gets counted. Somebody in the firm works those enquiries. Calls, emails, diary slots and follow-up all consume chargeable capacity, and dead leads consume more of it than good ones because they take longer to give up on. So the firm pays twice, once in spend and once in the time of the people who could have been doing client work.
Count past the lead
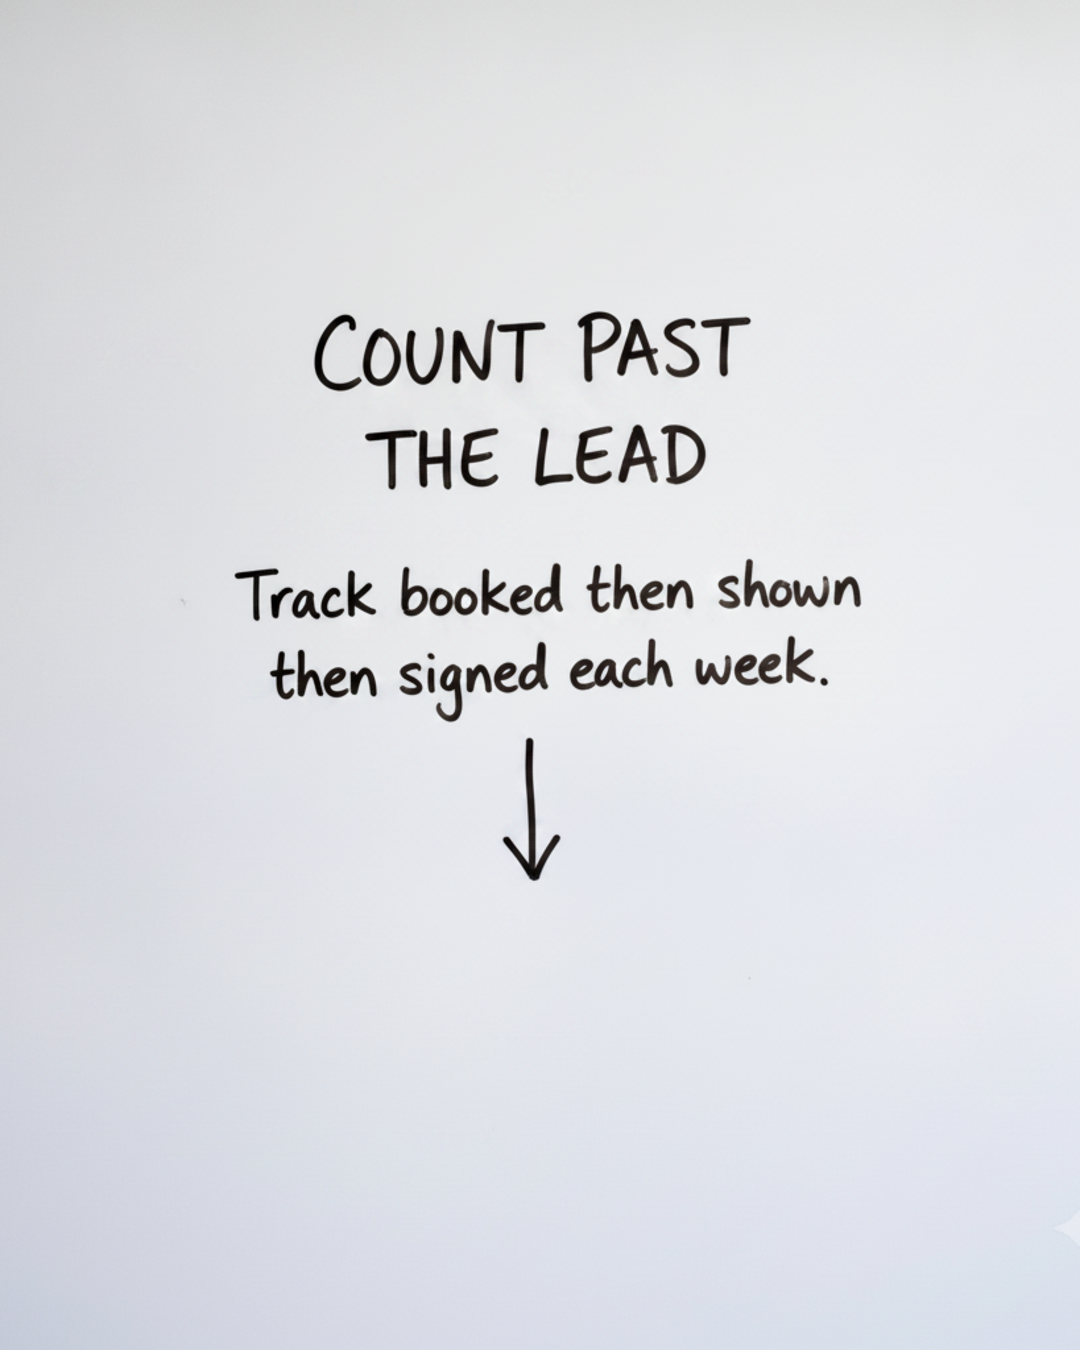
The fix does not require a new platform or a bigger budget. It requires counting three or four stages further along and doing it every week rather than every quarter.
The sequence we map with firms is deliberately short: enquiries received, calls booked, calls attended, proposals sent, clients signed. Five figures, recorded weekly, each one attributed back to the source that produced it. That is enough to show where the process leaks. A firm with strong enquiry volume and weak booking rates has a follow-up problem. Strong bookings with poor attendance is a reminder and qualification problem. Good attendance with few signings is a positioning or pricing problem. The same headline number hides all three.
What better reporting lets you do
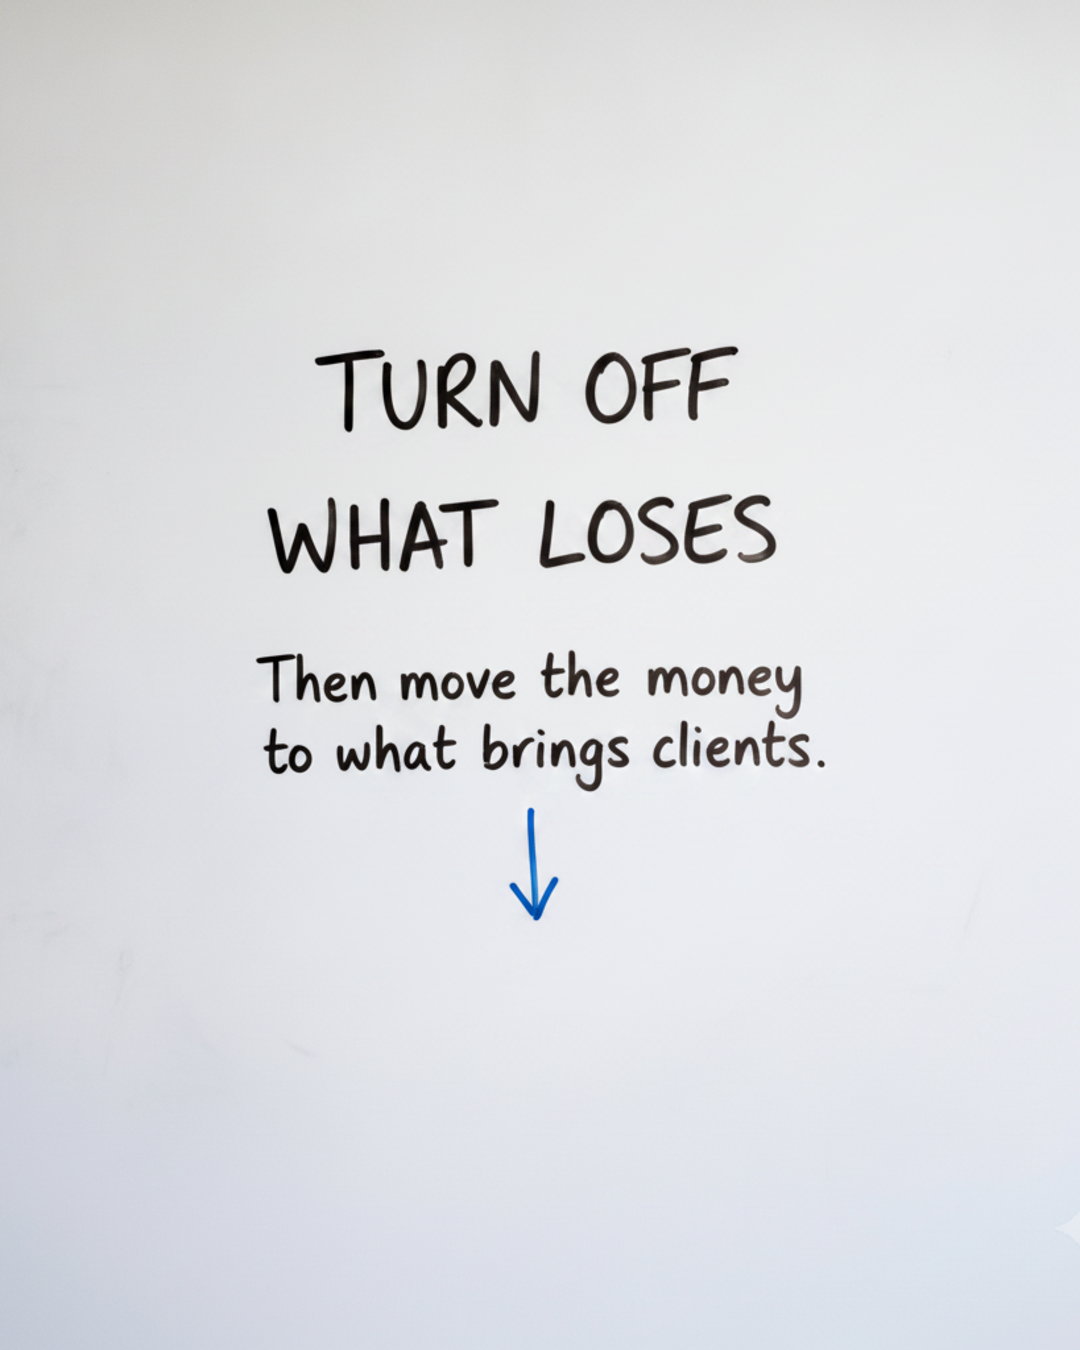
Once the stages are visible, the decisions become dull in the best way. A source that produces enquiries and no signed clients gets turned off. A source that produces fewer enquiries and more clients gets more of the budget. Nothing has to be argued about, because the figures are attributed and the pattern shows up within a few weeks rather than a few quarters.
This is where firms usually find that their spend was not too small. It was pointed at the wrong places, and there was no reporting capable of telling them so. Moving the same money toward what produces clients is normally the largest single improvement available, and it costs nothing extra.
One number is not proof

The standard a firm applies to a client's accounts is the standard to apply to its own marketing. One figure, read in isolation, describes a moment and not a position. It needs the pages behind it before it means anything.
None of this makes lead count useless. It is a perfectly good input measure and it belongs in the report. It simply cannot be the whole report, and it certainly cannot be the basis for deciding where money goes next month. Judge marketing the way you would judge a set of accounts, stage by stage, and the answers stop being a matter of opinion.
Where to start
Our position is that lead count tells you almost nothing on its own, and that most firms are steering real spend with it anyway. The correction is small. Record enquiries, bookings, attendance, proposals and signings each week, attributed to source, and review them together rather than in isolation.
There is a fair caveat. If your firm is genuinely early and volume is the constraint, counting leads is a reasonable place to begin, and the later stages will matter more once there is something to convert. The judgement is about where you actually are.
If the firm in this piece sounds like yours, the qualification quiz below will give you a straight answer either way about whether our approach fits.